Last updated: 1 August 2026
Nasdaq questions, answered.
What is the Nasdaq forecast for 2026? +
The Nasdaq-100 (NQ=F) trades near 28,700 in mid-2026, driven by AI sector growth, tech earnings, and Federal Reserve policy expectations. The index has been supported by strong performance from Magnificent Seven stocks including Apple, Microsoft, Nvidia, Amazon, Alphabet, Meta, and Tesla. Key risks include elevated valuations, potential rate cuts being slower than expected, and AI spending sustainability concerns.
What is the difference between NAS100 and US30? +
The NAS100 (Nasdaq-100) tracks the 100 largest non-financial companies on Nasdaq, dominated by technology at over 60 percent weight. The US30 (Dow Jones) tracks 30 blue-chip industrial companies. NAS100 is more volatile and growth-oriented. US30 is more stable and value-oriented. NAS100 has outperformed US30 significantly during the AI boom from 2023 to 2026 but carries higher drawdown risk during tech corrections.
How do I trade Nasdaq futures? +
Nasdaq E-mini futures (NQ) trade on the CME nearly 24 hours a day, Sunday through Friday. The most liquid contract is the E-mini Nasdaq-100 (NQ) at $20 per point. For smaller accounts, Micro E-mini Nasdaq (MNQ) contracts at $2 per point are available. Trading requires a futures broker such as NinjaTrader, Tradovate, or Interactive Brokers and margin of approximately $18,000 per NQ contract.
Key levels & daily outlook
Updated daily before the London session open.
Daily bias
The NAS100's direction is primarily driven by US tech sector sentiment, Fed policy expectations, and Treasury yields. When the Fed signals rate cuts and yields fall, the index typically rallies. Monitor the US 10-year yield and tech earnings for intraday directional bias.
Session timing
The NAS100 is most active during the US pre-market (12:00–14:30 UTC) and the regular US session (14:30–21:00 UTC). The US open at 14:30 UTC produces the largest moves and highest volume, especially after major tech earnings or Fed announcements.
Trade these levels with confidence. Get exact entry, SL, and TP signals delivered instantly.
What drives the NAS100?
Understanding these factors helps you anticipate the NAS100's next move.
Fed Policy & Interest Rates
The NAS100 is highly sensitive to Fed rate decisions. Dovish signals (rate cuts, accommodative stance) push the index higher. Hawkish surprises trigger selloffs.
Tech Earnings
The Nasdaq 100 is tech-heavy (Apple, Microsoft, Nvidia, etc.). Strong earnings from mega-cap tech drives the entire index higher. Earnings season is the biggest regular catalyst.
Market Sentiment
Risk-on sentiment fuels the NAS100. When investors are optimistic about growth, they rotate into growth/tech stocks. Risk-off periods trigger outflows into defensive assets.
Treasury Yields
Rising long-term yields compress tech valuations (future cash flows discounted more heavily). Falling 10Y yields are typically very bullish for the NAS100.
Economic Data
Jobs reports (NFP), CPI inflation, GDP growth, and PMI data all move the NAS100. The index responds to data that shifts Fed rate expectations.
Sector Rotation
Money flows between growth/tech and value/cyclicals. When rates fall, money rotates into growth (bullish for NAS100). When rates rise, the rotation out hits the index hard.
NAS100 price history
Key milestones in the NAS100 index history.
Long-term trend: The NAS100 has risen from 4,816 in 2000 to over 24,000 in 2026 — a 5x increase over 26 years. The acceleration since 2020 (doubling) reflects the tech-driven economy, AI boom, and accommodative monetary policy. Most institutional analysts project continued growth as AI and technology reshape global markets.
NAS100 FAQ
What is the current NAS100 price? +
The live NAS100 index price is shown in the chart above, updated in real-time during market hours. The Nasdaq 100 futures trade nearly 24 hours, with highest activity during the US session (14:30–21:00 UTC).
What time does the NAS100 trade? +
NAS100 futures trade nearly 24 hours from Sunday 22:00 UTC to Friday 21:00 UTC. The most active session is the US cash market (14:30–21:00 UTC), especially the opening hour which produces the biggest moves.
What makes the NAS100 go up? +
The NAS100 rises when: the Fed signals rate cuts, tech earnings beat expectations, Treasury yields fall, risk appetite is strong, or AI/tech innovation drives growth optimism.
What makes the NAS100 go down? +
The NAS100 falls when: the Fed raises rates or signals hawkishness, tech earnings disappoint, yields spike, risk-off sentiment takes hold, or economic data suggests recession.
Is the NAS100 a good investment in 2026? +
The NAS100 has risen from 12,888 (2020) to 24,000+ (2026). Many analysts remain bullish due to AI growth, potential Fed rate cuts, and continued tech sector expansion. However, past performance doesn't guarantee future results. NasdaqSignals provides signals — not investment advice.
How can I trade the NAS100? +
You can trade NAS100 through any broker that offers index CFDs — IC Markets, Pepperstone, OANDA, Exness, FTMO, and others. NasdaqSignals provides professional signals with exact entry, stop-loss, and take-profit levels to help you trade effectively.
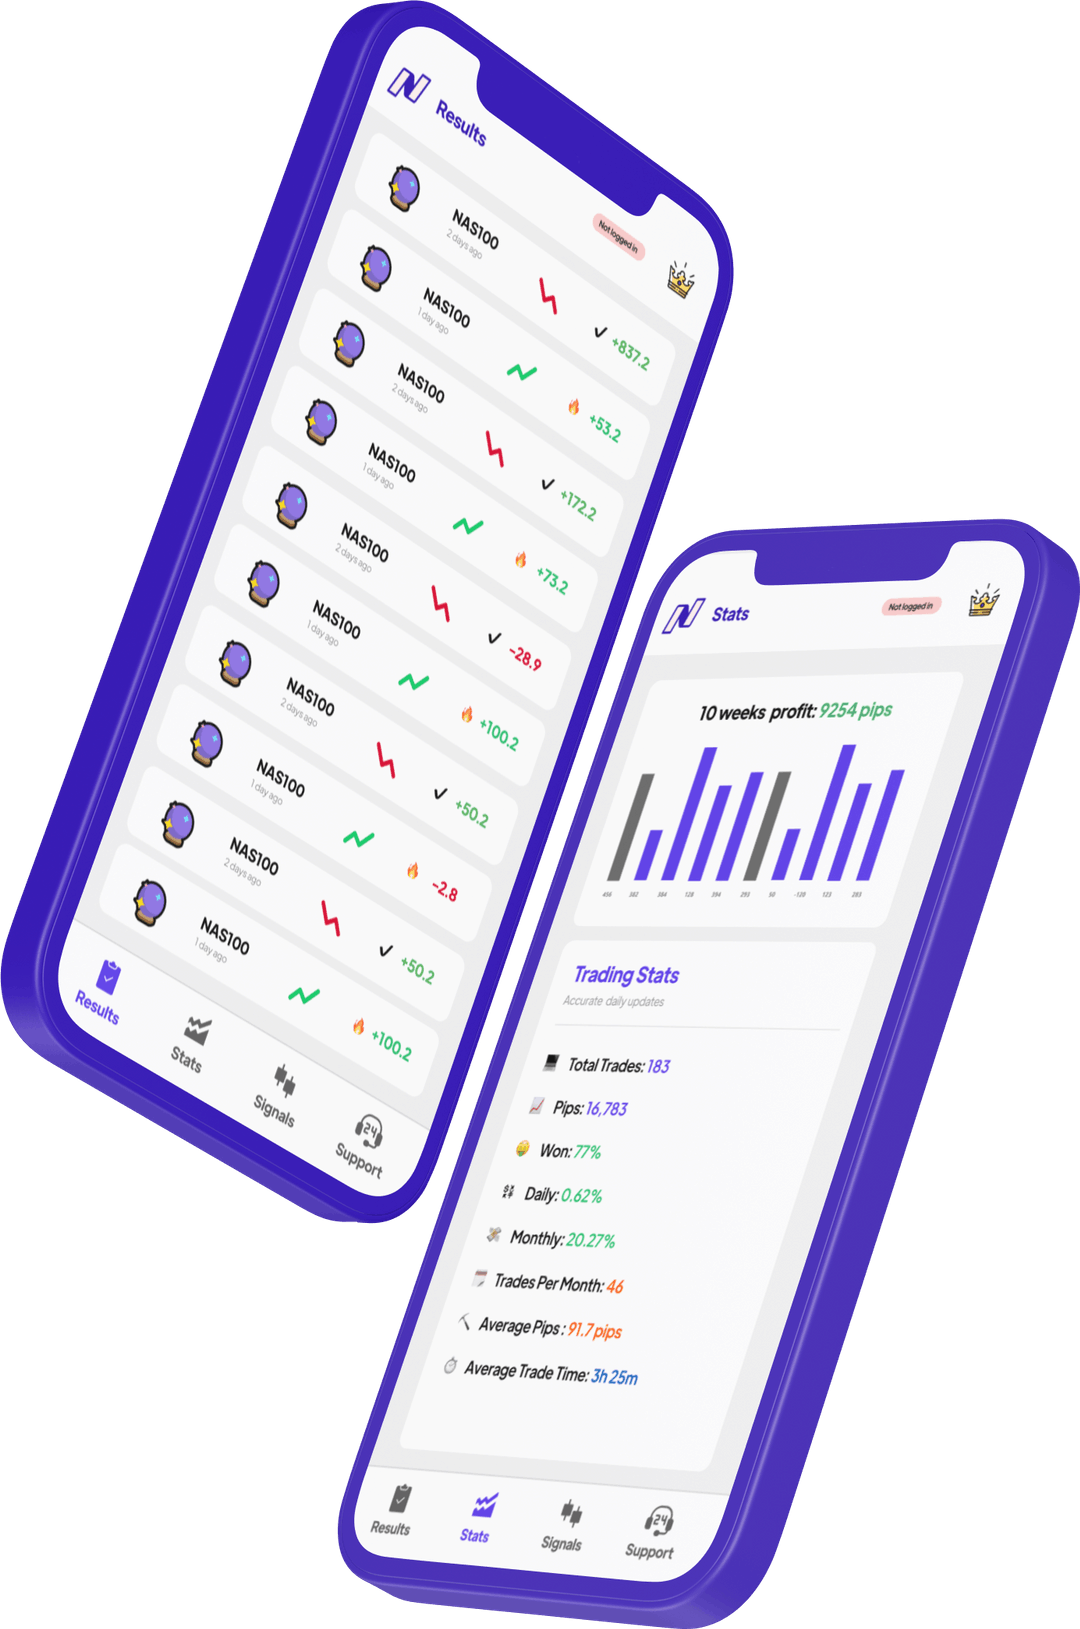
Get NAS100 signals live.
Professional NAS100 index alerts with entry, SL, and TP. Download free.