 NASDAQSIGNALS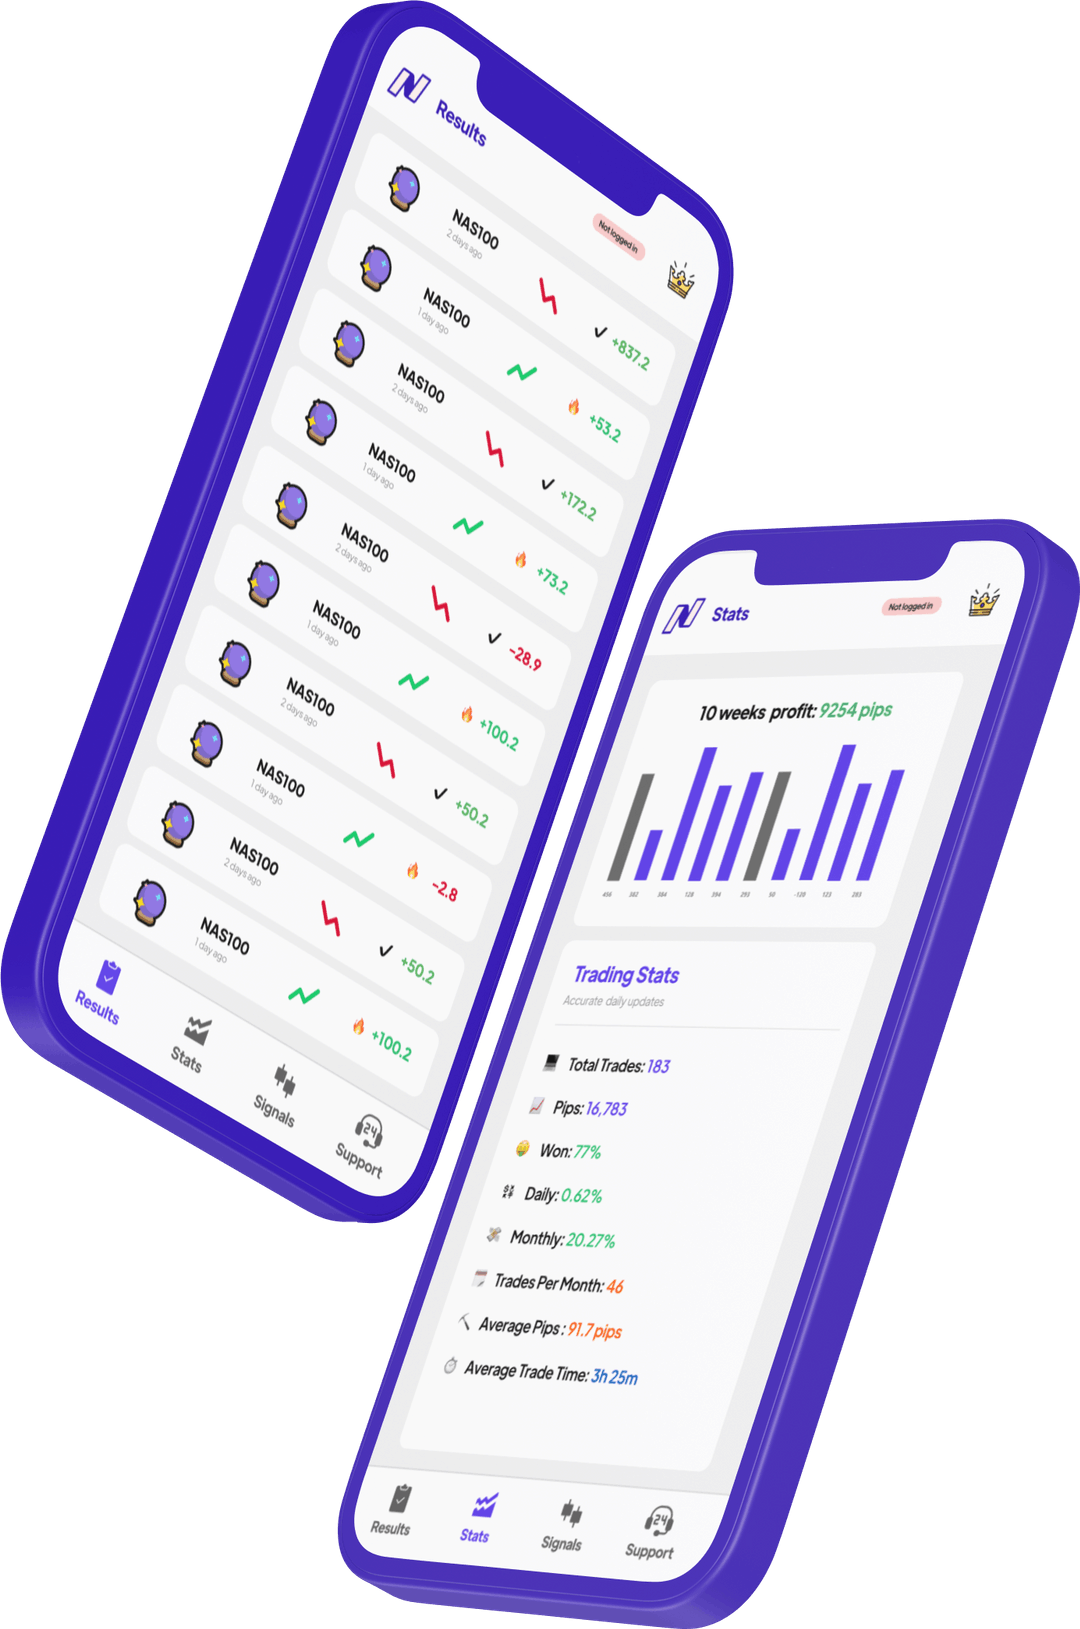
What are NDX signals?
Understanding the NDX
The NDX (Nasdaq-100 Index) is the benchmark that tracks the 100 largest non-financial companies listed on the Nasdaq exchange — Apple, Microsoft, Nvidia, Amazon, Meta, Tesla, and more. While the index itself isn't directly tradeable, it's the reference price for NQ futures, MNQ micros, QQQ ETF, and NAS100 CFDs. NDX signals tell you where the index is heading next.
How to trade the NDX
- Via NQ futures (CME, $20/point)
- Via MNQ micros (CME, $2/point)
- Via NAS100 CFDs on any forex broker
- Via QQQ ETF or NDX options
- Same signals work across all vehicles
Our NDX signals include.
Watch NDX signals in action.
See real-time Nasdaq-100 index trade execution on the NasdaqSignals app.
A feed you can verify.
Every signal we publish is timestamped and price-stamped. Scroll the last few — the same feed you see the second you sign in.
NDX index trading strategies.
Scalping
1–30 minQuick 5–15 point scalps off NDX support/resistance levels during US session.
Day Trading
1–8 hoursIntraday NDX positions driven by tech sector momentum and volume.
Swing Trading
1–5 daysMulti-day NDX positions around earnings season and macro catalysts.
News-Based
MinutesReactive NDX trades around FOMC, CPI, and Big Tech earnings reports.
NDX at a glance.
An NDX signal breakdown (via NQ).
The signal
Execution options
How to trade NDX signals step by step.
Choose your trading vehicle
Pick how you will execute: NQ futures ($20/pt for experienced traders), MNQ micros ($2/pt for smaller accounts), NAS100 CFDs (any forex broker), or QQQ shares (any stock broker). The NDX index level is the same — only your contract size differs.
Download the NasdaqSignals app
Install from the App Store or Google Play. Enable push notifications. Signals are delivered as NDX index levels — you execute them on whichever vehicle you have chosen.
Size your position
NDX signals use index-level stops. Convert to your vehicle: 70 NDX points = $1,400 on NQ, $140 on MNQ, or ~$0.70/share on QQQ. Size so one trade risks 1–2% of your account.
Execute and manage
When a signal arrives, enter on your chosen vehicle at the NDX-equivalent price. Set stop-loss and take-profit levels. Our analysts manage the trade live with SL adjustments and move-to-breakeven updates.
NDX trading vehicles compared.
| Feature | NDX (Index) | NQ Futures | MNQ Micros | QQQ ETF |
|---|---|---|---|---|
| Tradeable? | No (benchmark) | Yes — CME | Yes — CME | Yes — NASDAQ |
| Point value | Reference only | $20/pt | $2/pt | $1/share |
| Min capital | N/A | ~$5,000 | ~$500 | ~$500 |
| Trading hours | N/A | 23h/day | 23h/day | 9:30–16:00 ET |
| IRA eligible? | N/A | No | No | Yes |
| Options? | NDX options exist | Yes | No | Yes |
| Best for | Signal reference | Experienced traders | Smaller accounts | Stock traders |
Why NDX traders choose us.
Performance metrics
NDX signals FAQ.
What are NDX signals? ▼
NDX signals are trade alerts based on the Nasdaq-100 Index price. Each signal includes a precise index level for entry, a stop-loss, and up to three take-profit targets. Since the NDX is an index (not directly tradeable), you execute these signals via NQ futures, MNQ micros, NAS100 CFDs, or QQQ ETF — whichever suits your account and broker.
Can I trade the NDX index directly? ▼
No — the NDX (Nasdaq-100 Index) is a benchmark, not a tradeable instrument. But you can trade products that track it 1:1: NQ futures ($20/point), MNQ micros ($2/point), NAS100 CFDs, or the QQQ ETF. Our NDX signals work for all of them — the index level is the same across every vehicle.
What's the difference between NDX and NAS100? ▼
The NDX is the official Nasdaq-100 Index benchmark. NAS100 is what CFD brokers call their Nasdaq-100 contract — it tracks the NDX price exactly. Same index, different name. NDX signals and NAS100 signals are interchangeable — the entry, SL, and TP levels are identical.
Which is best for trading NDX signals: NQ, MNQ, or NAS100? ▼
NQ ($20/pt) suits experienced traders with larger accounts. MNQ ($2/pt) is ideal for smaller accounts or scaling positions. NAS100 CFDs offer flexible position sizing on any forex broker. Our signals work identically across all three — pick the vehicle that fits your account size and broker.
More Nasdaq trading resources.
NQ Futures Signals
E-mini Nasdaq-100 futures signals for CME traders.
MNQ Futures Signals
Micro Nasdaq-100 futures signals for smaller accounts.
QQQ ETF Signals
Invesco QQQ ETF signals — trade the Nasdaq via equities.
NAS100 Signals
Live NAS100 CFD signals with 93% accuracy.
What Is the NAS100?
Complete guide to the Nasdaq-100 index and how it trades.
Best Nasdaq Brokers
Compare brokers for every Nasdaq trading vehicle.
Add a second edge to your NAS100 trading.
If you're already trading NAS100 profitably, NasdaqSignals isn't a replacement — it's a second opinion. Compare our analyst calls against your own setups. Many experienced traders use us to confirm bias or catch setups they'd otherwise miss during off-hours.
- → Use as confirmation for your own analysis
- → Catch setups during sessions you can't watch
- → 93% win rate across 1000+ verified trades
- → No lock-in — view results before subscribing
Gold trading questions, answered.
What is the current gold price per ounce in USD? +
The live XAU/USD gold price updates every 15 seconds on our gold price page. As of May 2026, gold trades above $3,300 per troy ounce. Gold (XAU/USD) trades 24 hours a day, 5 days a week — from Sunday 22:00 UTC to Friday 22:00 UTC. The most liquid sessions are London (07:00–16:00 UTC) and New York (12:00–21:00 UTC).
How accurate are NasdaqSignals XAU/USD signals? +
NasdaqSignals maintains a 93% win rate calculated across all closed XAU/USD trades since 2018. This is verified publicly — every signal (wins and losses) is timestamped and logged in the app. The average winning trade captures 91.7 pips, with an average trade duration of 3 hours 25 minutes. We publish 4–8 signals per trading day.
What does a gold trading signal include? +
Every NasdaqSignals signal includes: exact entry price (or range), stop-loss level, three take-profit targets (TP1, TP2, TP3), suggested lot size based on 1% risk, and the trade direction (BUY or SELL). After entry, we send live management updates — SL adjustments, partial close instructions, and "move to breakeven" alerts.
What moves the gold price? +
Gold (XAU/USD) is primarily driven by 5 factors: (1) US real interest rates — gold is inversely correlated to yields; (2) US Dollar strength (DXY) — weaker dollar = higher gold; (3) Geopolitical risk — wars, sanctions, and elections drive safe-haven demand; (4) Central bank buying — BRICS nations accumulated record gold in 2023–2026; (5) Inflation expectations — gold acts as an inflation hedge when CPI rises faster than expected.
How much capital do I need to trade gold? +
You can start trading XAU/USD with as little as $100–$500 using brokers that offer micro lots (0.01 lot). At 1% risk per trade with a typical 30-pip stop-loss on gold, a $1,000 account would risk $10 per trade with a position size of approximately 0.03 lots. NasdaqSignals signals include lot size recommendations based on your account size.
Which broker should I use for gold trading? +
NasdaqSignals signals work with any broker offering XAU/USD. Popular choices: IC Markets (raw spread $0.05, best for scalpers), Exness (unlimited leverage for pros, instant withdrawals), and Pepperstone (FCA regulated, TradingView integration). Key factors: spread (lower is better — aim for under $0.30), execution speed, regulation, and platform support (MT4/MT5/cTrader).
What is the best time to trade gold? +
Gold is most active during the London-New York overlap (12:00–16:00 UTC), when both sessions are open simultaneously. This period produces the largest moves and tightest spreads. The London session open (07:00 UTC) often sets the day's direction. The Asian session (00:00–07:00 UTC) is quieter — good for range trading but avoid breakout strategies.
Is gold trading risky? +
Yes. Gold (XAU/USD) is one of the most volatile instruments — it regularly moves $30–$80 per day (300–800 pips). With leverage, losses can exceed your deposit. Never risk more than 1–2% of your account per trade. Always use a hard stop-loss. NasdaqSignals includes a pre-calculated stop-loss on every signal to limit downside risk.
Get NDX signals now.
Nasdaq-100 Index trading alerts. Free download. No card required.