What is NAS100 trading?
NAS100 trading explained
The NAS100 tracks the Nasdaq 100 index — the 100 largest non-financial companies listed on the Nasdaq exchange, weighted by market cap. It trades as a CFD or futures contract through brokers. Unlike stocks, you can trade the index in both directions: buy (long) when you expect tech/growth to rise, or sell (short) when you expect a pullback.
Why trade the NAS100?
- Exposure to top tech companies (Apple, Microsoft, Nvidia)
- Large daily ranges = high profit potential
- Clear fundamental drivers (tech earnings, Fed policy)
- Deeply liquid — tight spreads on every major broker
- Can be traded with leverage for capital efficiency
- Strong long-term uptrend — the index has doubled since 2020
What moves the NAS100 price?
Understanding these drivers is essential for anticipating NAS100 direction.
Fed Policy
The NAS100 is highly sensitive to Fed rate decisions. Dovish signals push the index higher; hawkish surprises trigger selloffs.
Tech Earnings
Apple, Microsoft, Nvidia, and other mega-caps drive the index. Strong earnings season = bullish; misses = sharp corrections.
Market Sentiment
Risk-on sentiment fuels the NAS100. When investors are optimistic about growth, money flows into tech.
Treasury Yields
Rising long-term yields compress tech valuations. Falling 10Y yields are typically very bullish for the NAS100.
Economic Data
NFP, CPI, GDP, and PMI data move the index. The NAS100 responds to anything that shifts Fed rate expectations.
AI & Innovation
Breakthroughs in AI, cloud, and semiconductors drive massive rallies. The NAS100 is the world's technology benchmark.
Watch NAS100 trading in action.
See professional NAS100 signal execution on NasdaqSignals.
NAS100 trading strategies.
Trend Following
Identify the higher-timeframe direction and trade with it. Use moving averages (50/200 EMA) for confirmation.
Breakout Trading
Wait for price to break key support/resistance with momentum. Enter on the break, SL below the level.
Range Trading
During consolidation, buy at support and sell at resistance. Works well in quiet Asian sessions.
News Trading
React to NFP, CPI, FOMC. The NAS100 can move 200+ points in minutes. Requires fast execution and wider stops.
Signal-Based Trading
Let NasdaqSignals analysts do the analysis. Receive entry/SL/TP, copy into your broker. Best for busy traders.
Scalping
Quick 5–30 pip trades on M1–M5 charts during London/NY overlap. High frequency, tight risk.
Protect your capital.
Risk management is more important than any strategy. Follow these rules religiously.
Never risk more than 1–2% per trade
If your account is $10,000, risk max $100–$200 per trade. This keeps you in the game through inevitable losing streaks.
Always use a hard stop-loss
No exceptions. Mental stops don't work. Set the SL in your broker before the trade is live. NasdaqSignals provides one on every signal.
Position size from risk, not greed
Calculate your lot size from your stop distance and risk amount. Never pick a lot size first — let the math decide.
Cut losers fast, let winners run
Move SL to breakeven after TP1 hits. Take partials at TP2. Let the rest ride to TP3. Never add to losing positions.
Live NAS100 levels + signals.
Get auto-calculated support/resistance based on daily pivot points, plus live signals that fire when price approaches these levels. No more watching charts all day.
- → Daily pivot-based S1/S2/R1/R2
- → Signals fire at key levels automatically
- → Session-aware (London/NY overlap prioritised)
- → Lot size pre-calculated for 1% risk
Gold trading questions, answered.
What is the current gold price per ounce in USD? +
The live XAU/USD gold price updates every 15 seconds on our gold price page. As of May 2026, gold trades above $3,300 per troy ounce. Gold (XAU/USD) trades 24 hours a day, 5 days a week — from Sunday 22:00 UTC to Friday 22:00 UTC. The most liquid sessions are London (07:00–16:00 UTC) and New York (12:00–21:00 UTC).
How accurate are NasdaqSignals XAU/USD signals? +
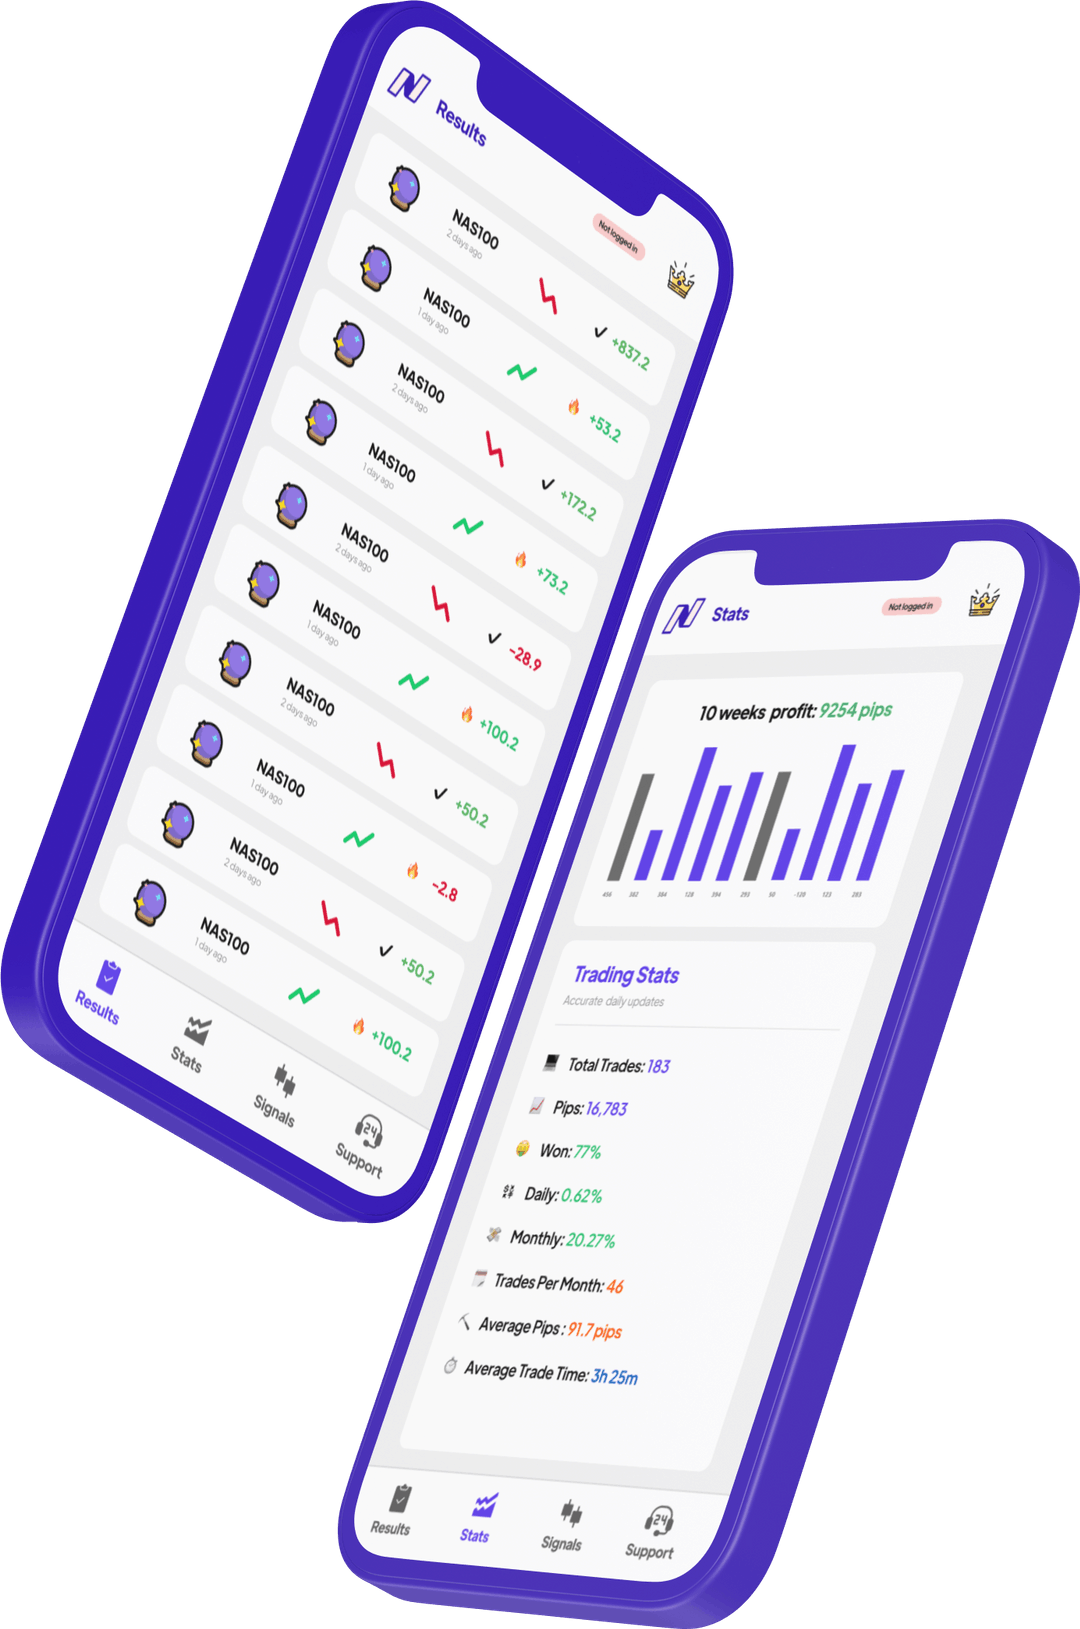
NasdaqSignals maintains a 93% win rate calculated across all closed XAU/USD trades since 2018. This is verified publicly — every signal (wins and losses) is timestamped and logged in the app. The average winning trade captures 91.7 pips, with an average trade duration of 3 hours 25 minutes. We publish 4–8 signals per trading day.
What does a gold trading signal include? +
Every NasdaqSignals signal includes: exact entry price (or range), stop-loss level, three take-profit targets (TP1, TP2, TP3), suggested lot size based on 1% risk, and the trade direction (BUY or SELL). After entry, we send live management updates — SL adjustments, partial close instructions, and "move to breakeven" alerts.
What moves the gold price? +
Gold (XAU/USD) is primarily driven by 5 factors: (1) US real interest rates — gold is inversely correlated to yields; (2) US Dollar strength (DXY) — weaker dollar = higher gold; (3) Geopolitical risk — wars, sanctions, and elections drive safe-haven demand; (4) Central bank buying — BRICS nations accumulated record gold in 2023–2026; (5) Inflation expectations — gold acts as an inflation hedge when CPI rises faster than expected.
How much capital do I need to trade gold? +
You can start trading XAU/USD with as little as $100–$500 using brokers that offer micro lots (0.01 lot). At 1% risk per trade with a typical 30-pip stop-loss on gold, a $1,000 account would risk $10 per trade with a position size of approximately 0.03 lots. NasdaqSignals signals include lot size recommendations based on your account size.
Which broker should I use for gold trading? +
NasdaqSignals signals work with any broker offering XAU/USD. Popular choices: IC Markets (raw spread $0.05, best for scalpers), Exness (unlimited leverage for pros, instant withdrawals), and Pepperstone (FCA regulated, TradingView integration). Key factors: spread (lower is better — aim for under $0.30), execution speed, regulation, and platform support (MT4/MT5/cTrader).
What is the best time to trade gold? +
Gold is most active during the London-New York overlap (12:00–16:00 UTC), when both sessions are open simultaneously. This period produces the largest moves and tightest spreads. The London session open (07:00 UTC) often sets the day's direction. The Asian session (00:00–07:00 UTC) is quieter — good for range trading but avoid breakout strategies.
Is gold trading risky? +
Yes. Gold (XAU/USD) is one of the most volatile instruments — it regularly moves $30–$80 per day (300–800 pips). With leverage, losses can exceed your deposit. Never risk more than 1–2% of your account per trade. Always use a hard stop-loss. NasdaqSignals includes a pre-calculated stop-loss on every signal to limit downside risk.
Start trading NAS100 today.
Download NasdaqSignals free. Professional signals, no experience needed.